Team MemberS: Mateo Alexander & Reina Dissa
Study Purpose
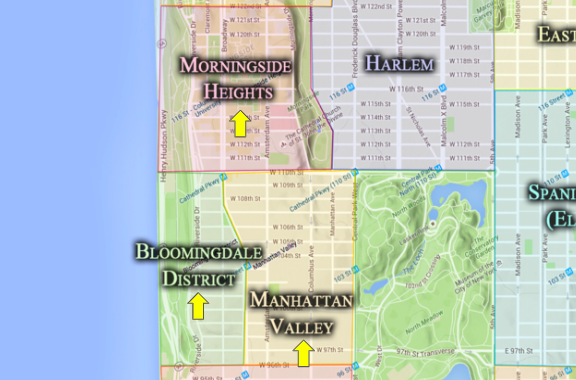
The purpose of this study is to examine exposure to secondhand smoke in respect to people’s pedestrian movement throughout the neighborhoods in Morningside Heights, Bloomingdale, and the Manhattan Valley and the Columbia campus. This study seeks to examine the exposure of individuals to secondhand smoke throughout the neighborhoods adjacent to Avery Hall and Columbia University. This corridor receives a large amount of pedestrian traffic every day as people are constantly walking in the Morningside Heights, Bloomingdale, and the Manhattan Valley neighborhoods both to walk toward Columbia University, away from Columbia University, and toward the mixed use corridors in the Bloomingdale and the Manhattan Valley neighborhoods. We expected to see high smoker concentrations in front of bars, delis, restaurants, and smoke shops. We also expected people to be smoking at the same spots, as detected by cigarette butts on the ground. We also expected the secondhand smoke radius to be large enough to measure.
Research Question:
How harmful can secondhand smoke be when someone is walking past?
Data Sensors and Collection
The study will utilize several different types of sensors including a smartphone as a physical push button and GPS sensor to record the location with the timestamp of where different smokers were observed. This will be the primary mode of data collection to collect the concentrations of smokers in the neighborhood at various times of the day depending on the walking route. The study will be conducted using body sensors attached to the students or volunteers, in this case as a pilot, the ones who are going to gather the data are the authors. The sensors wearer will walk through the Morningside Heights, Bloomingdale, and the Manhattan Valley neighborhoods both to walk toward Columbia University, away from Columbia University, and toward the mixed-use corridors in the Bloomingdale and the Manhattan Valley neighborhoods. Additional sensors, such as particulate matter monitors, nicotine detectors, and polymer film sensors, will also be utilized. The particulate matter monitor measures the concentration of particulate matter throughout the air released from cigarettes. The nicotine detectors measure the concentration of nicotine in the air. The detectors help to detect tobacco smoke because it contains high levels of nicotine, a major cigarette chemical. The last sensor that will likely be utilized are polymer film sensors, a type of air quality sensor. These sensors can measure nicotine vapor molecules from secondhand smoke utilizing polymer films.
Data Types
The information from these sensors will be recorded as several different data types. There will be point data that will reflect the time and location where smokers were observed. There will be lines reflecting the walking routes we took throughout the day at certain times. Then, continuous polygon data will be collected, reflecting the air quality by measuring the different levels of particulate matter, nicotine, and nicotine vapor molecules. We expect to observe tiny drops in air quality when walking by smokers in Morningside Heights, Bloomingdale, and the Manhattan Valley neighborhoods.
Data Visualization
As for data visualization, we intend to use a map that displays the point data of the smokers, along with the walking route that we took. Visualization will be made of the total amounts of point data where smokers were observed. There will also be a time series that reflects the walking route and the smokers that were observed throughout the travel path to the different neighborhood destinations. The continuous polygon data of air quality (reflected in particulate matter, nicotine, and nicotine vapor levels), will also be integrated into the map. Based on the information about smokers found during the study, the amount of secondhand smoke breathed in will be estimated. The amount of chemicals that we were exposed to will also be estimated to roughly determine how much secondhand smoke we were exposed to over the course of the study.
Scales
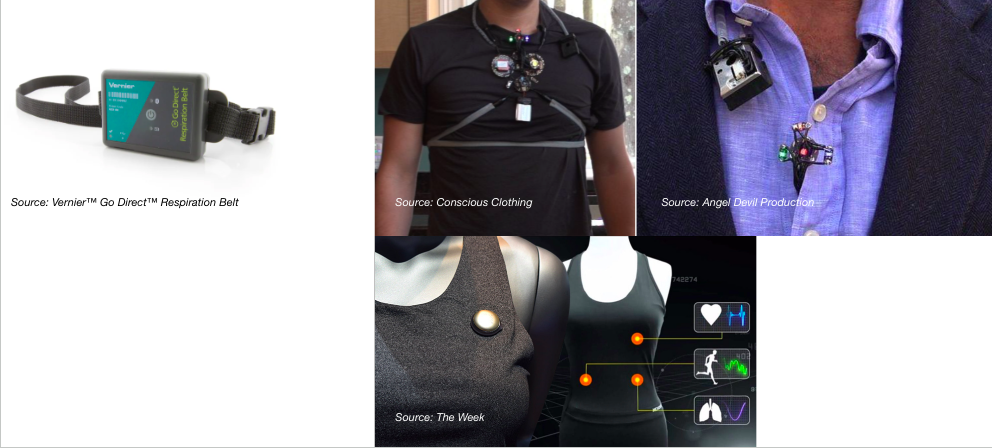
The study’s object scale involves using wearable sensors, and we are thinking of wearable devices that are more static, like embedded on a shirt or a belt. These devices have a subtle look, so the wearer does not feel like a walking clown in the neighborhood. On a larger scale, static sensors can be placed several feet from the smoking area to determine the air quality around the locus.
Technology & Expected Prototyping
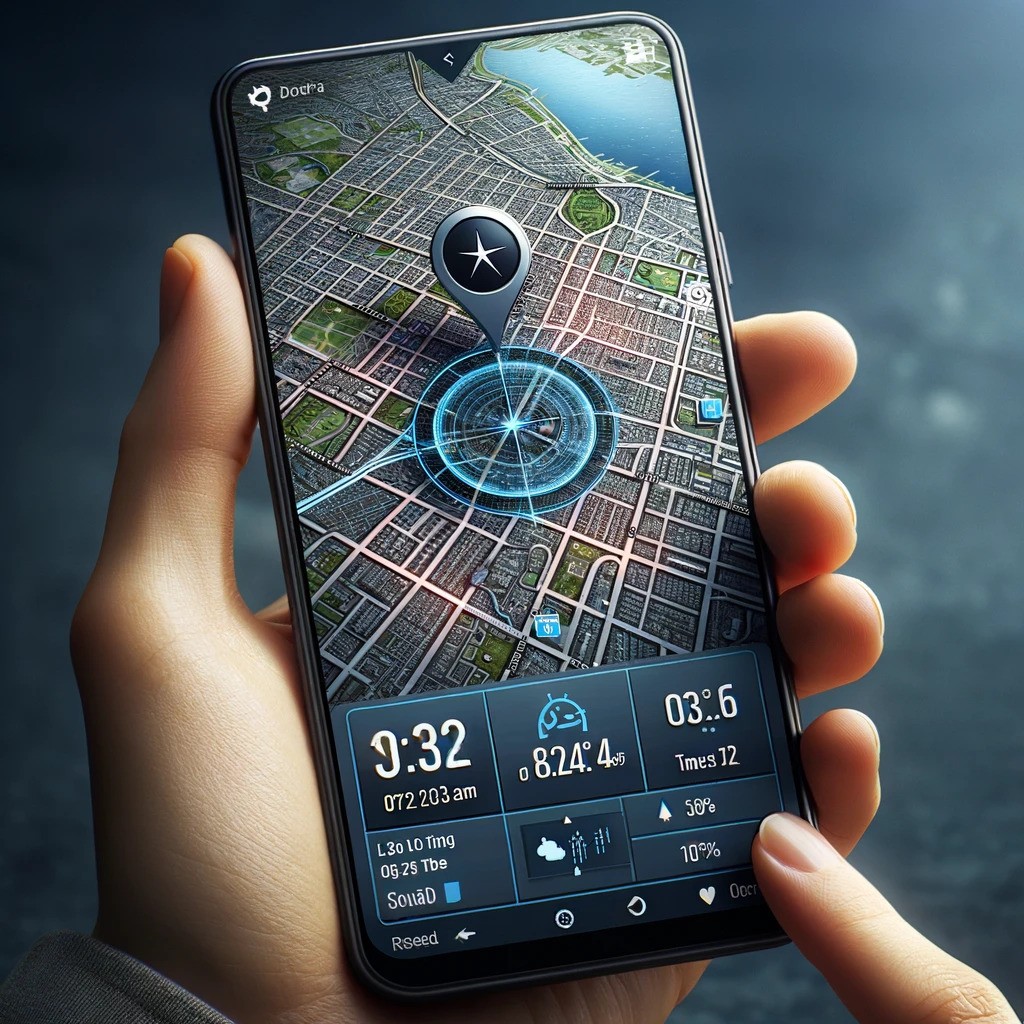
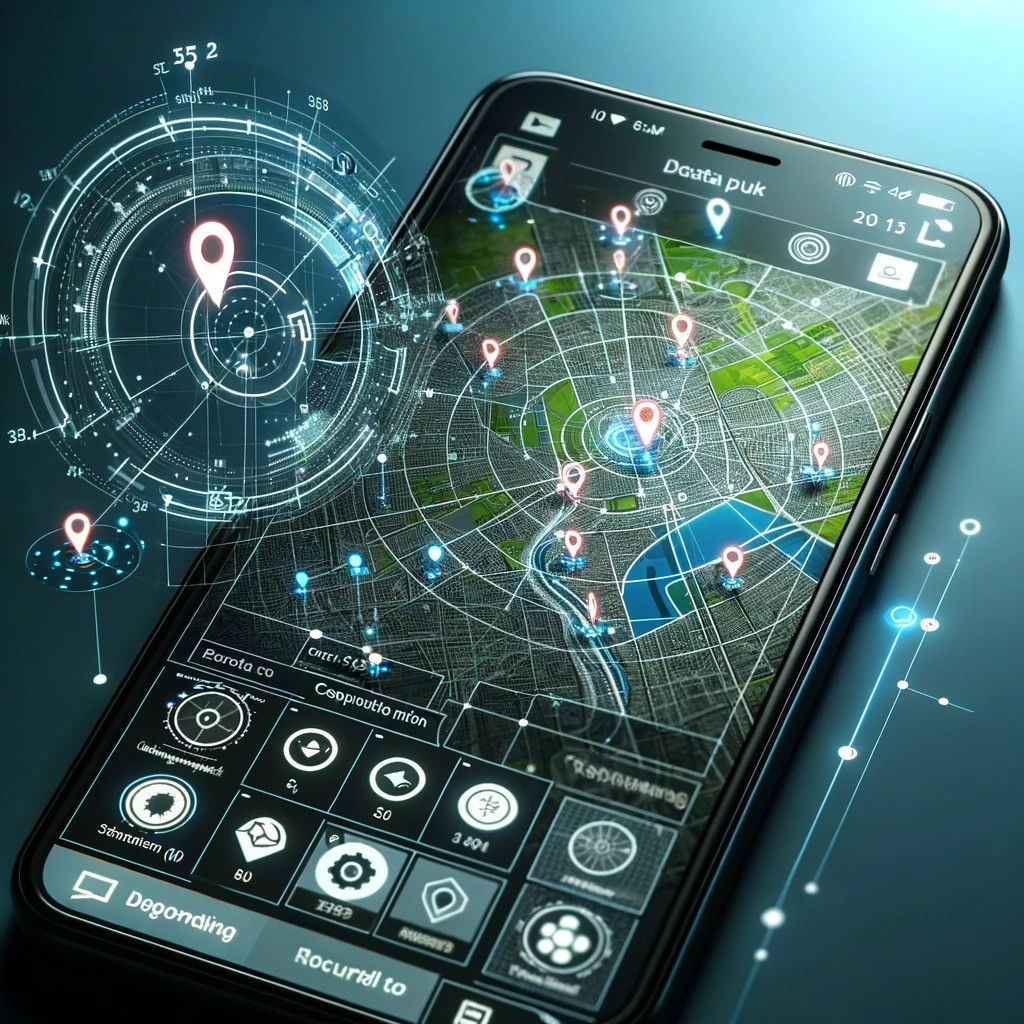
Images Generated in Collaboration with ChatGPT/DALLE
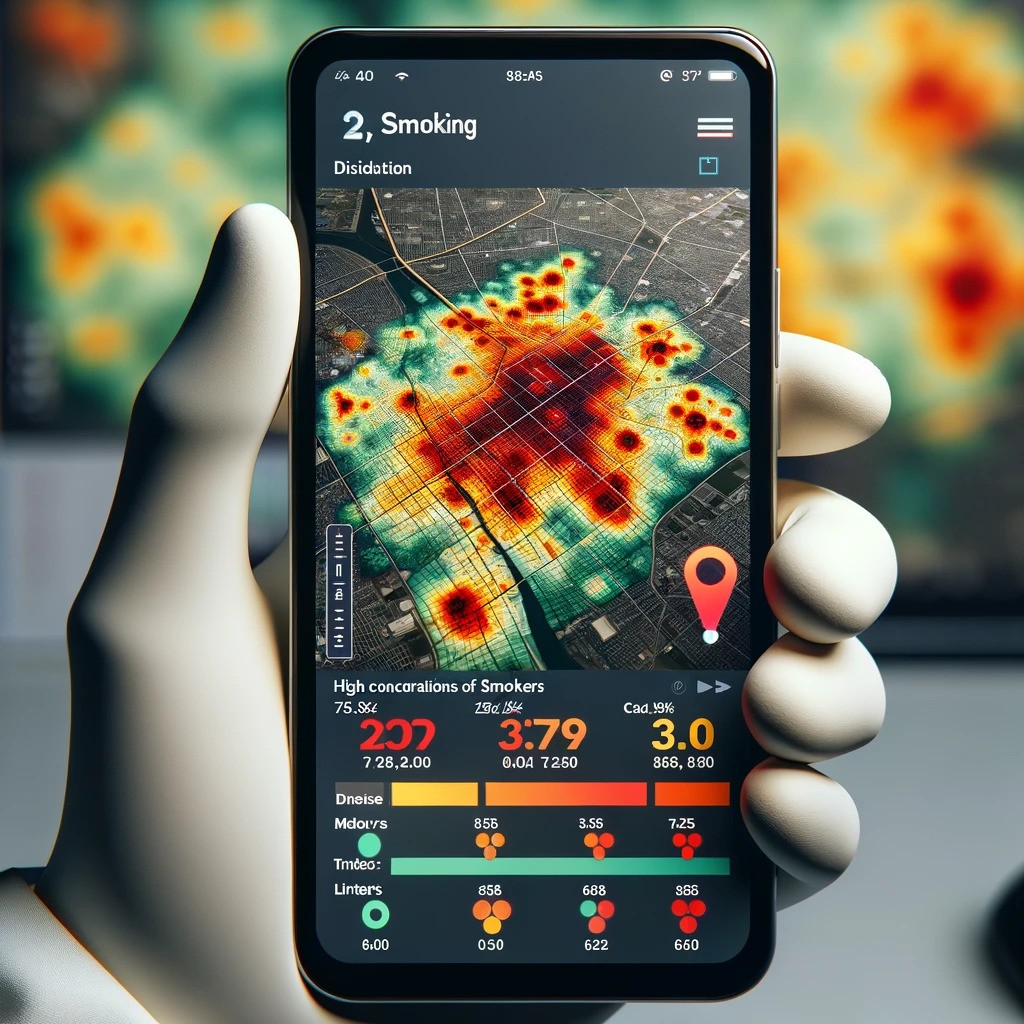
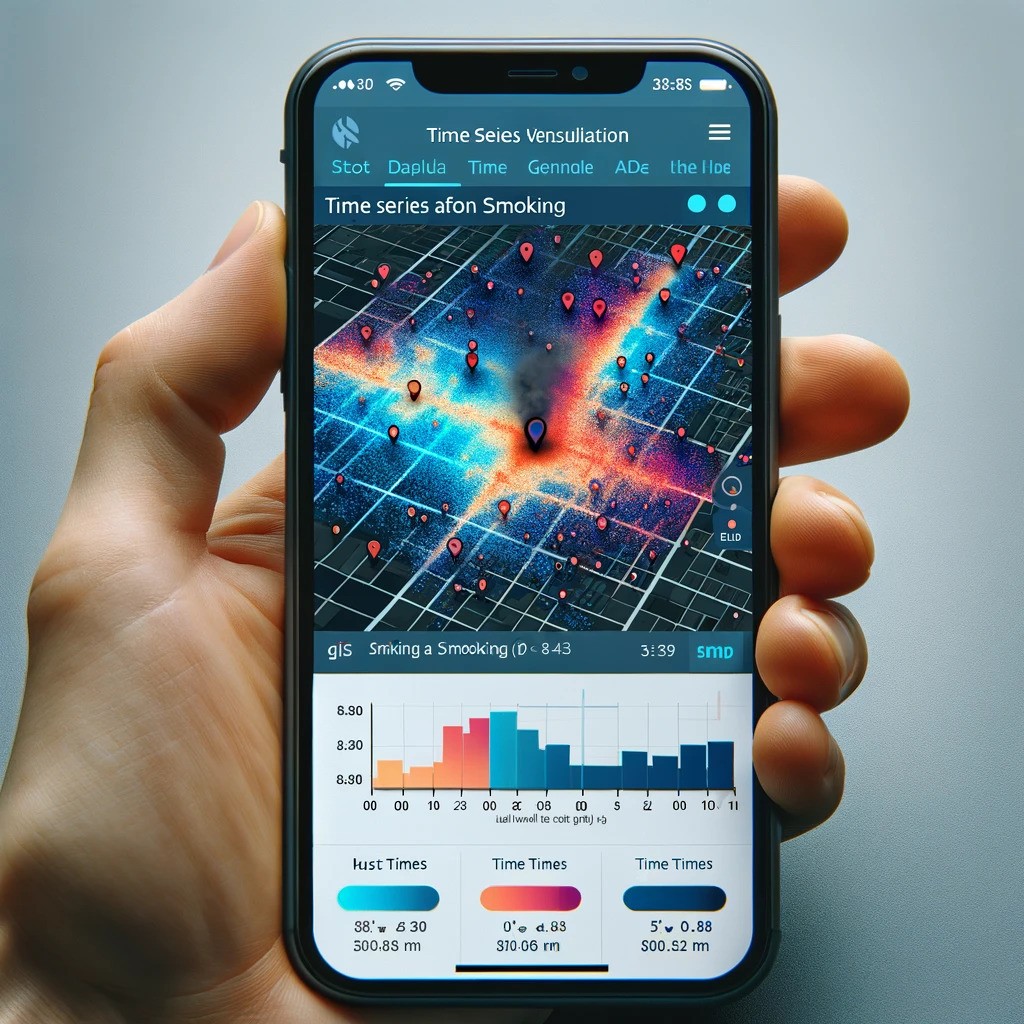
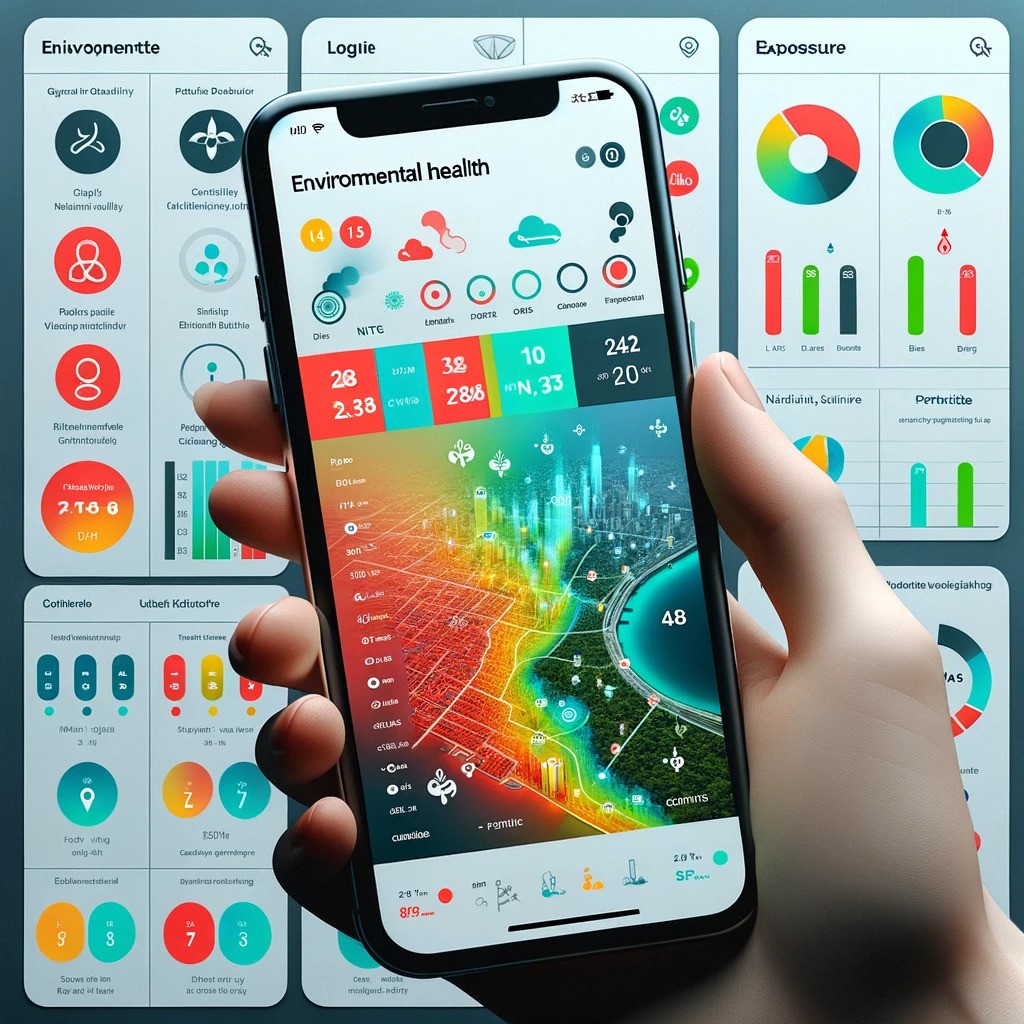
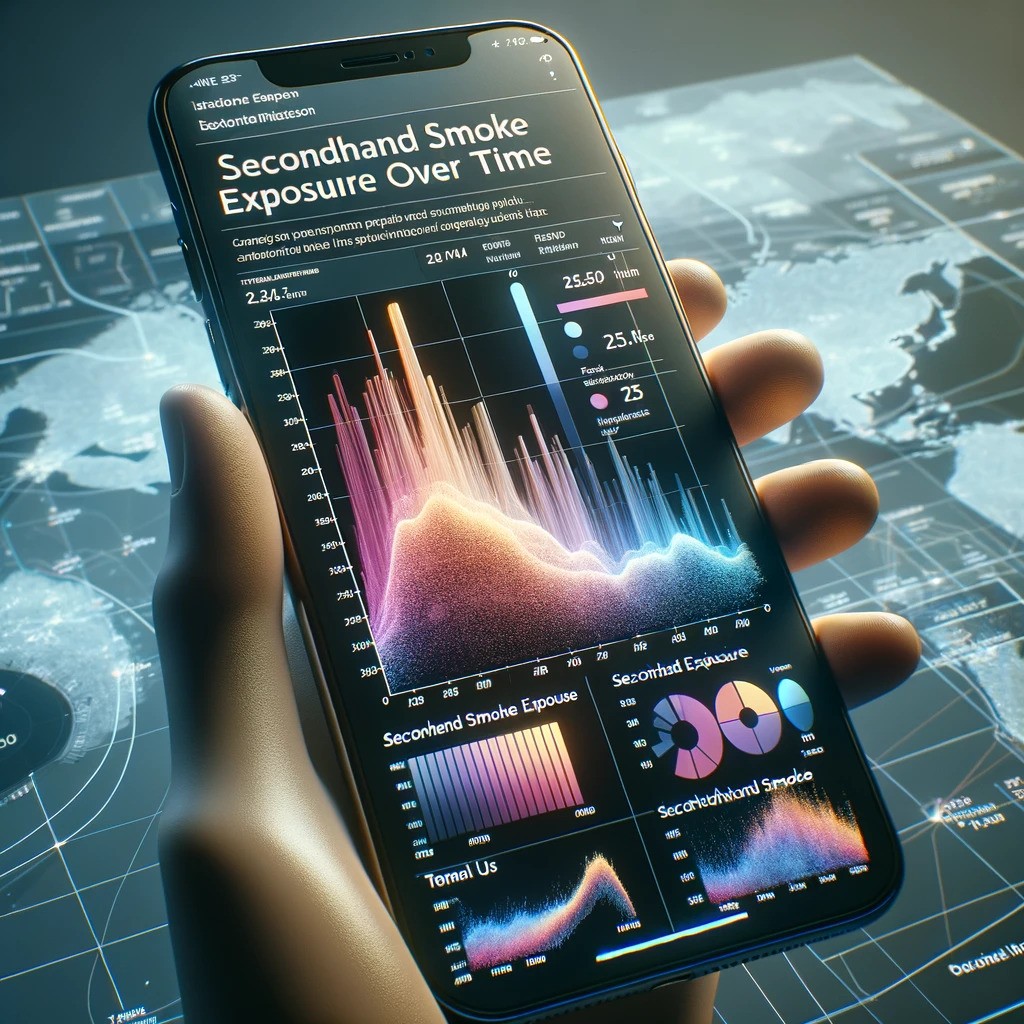
The image above shows the general process of the pedestrian secondhand smoke study in the Morningside Heights, Bloomingdale, and the Manhattan Valley neighborhoods and the Columbia campus. First, results will be recorded with the individual points of the smoker with a time and location stamp. The recording of results from several different times will result in the creation of a collective point map database. Next, different analyses can be performed including a cluster hot spot analysis to identify the areas in the neighborhood where there are higher concentrations of smokers overall. Next, the time series can be created in respect to the individual points that smokers were found, and the overall hotspots in the neighborhoods. The map can then be overlaid with different maps from data recorded from the air quality sensors, with respect to measured elements such as particulate matter and nicotine concentration in the air. In the end, a personalized map would be able to be created showing how much secondhand smoke an individual person was exposed to, as well as any other chemicals they might have been exposed to. This might also be able to be visualized in respect to the human body to how many toxins are consumed. We expect secondhand smoke in the neighborhood to be significant.
Prototyping Process & Testing
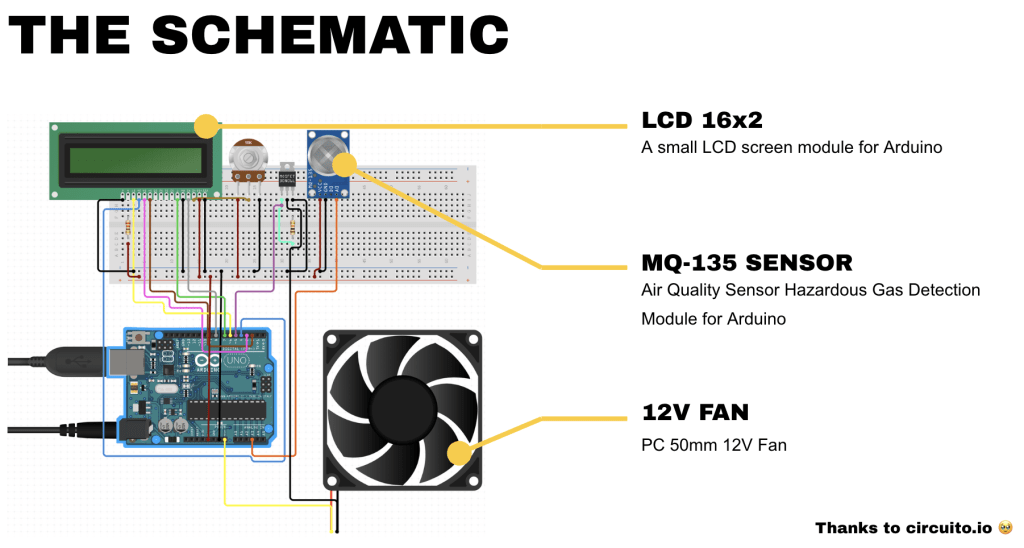
For the study, a MQ-135 sensor was selected which is an air quality hazardous gas detection module for Arduino. An LCD 16×2 screen module for Arduino was utilized to display the air quality index (AQI) measurement. A 12 Volt fan was utilized to suck air in toward the sensors.
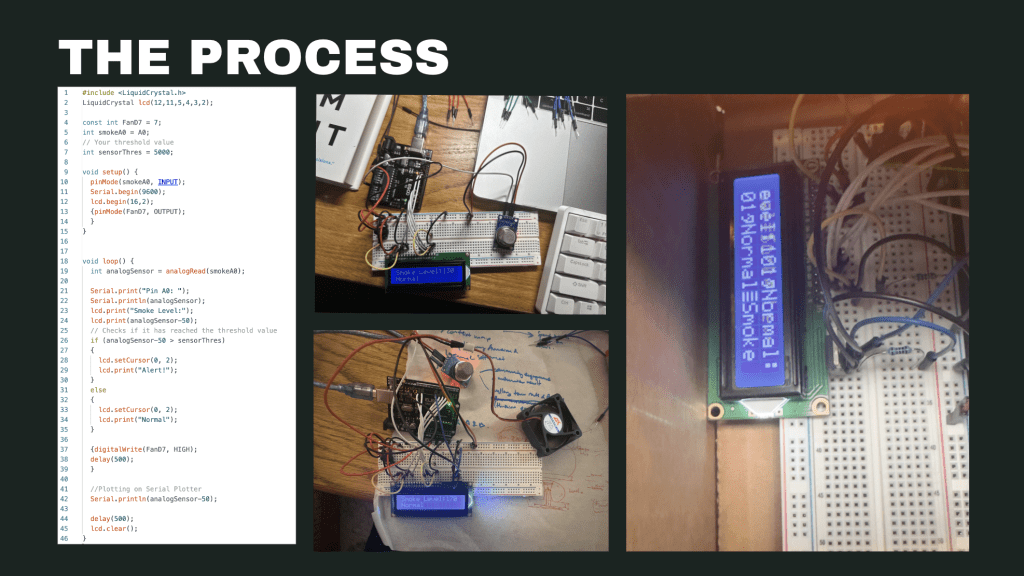
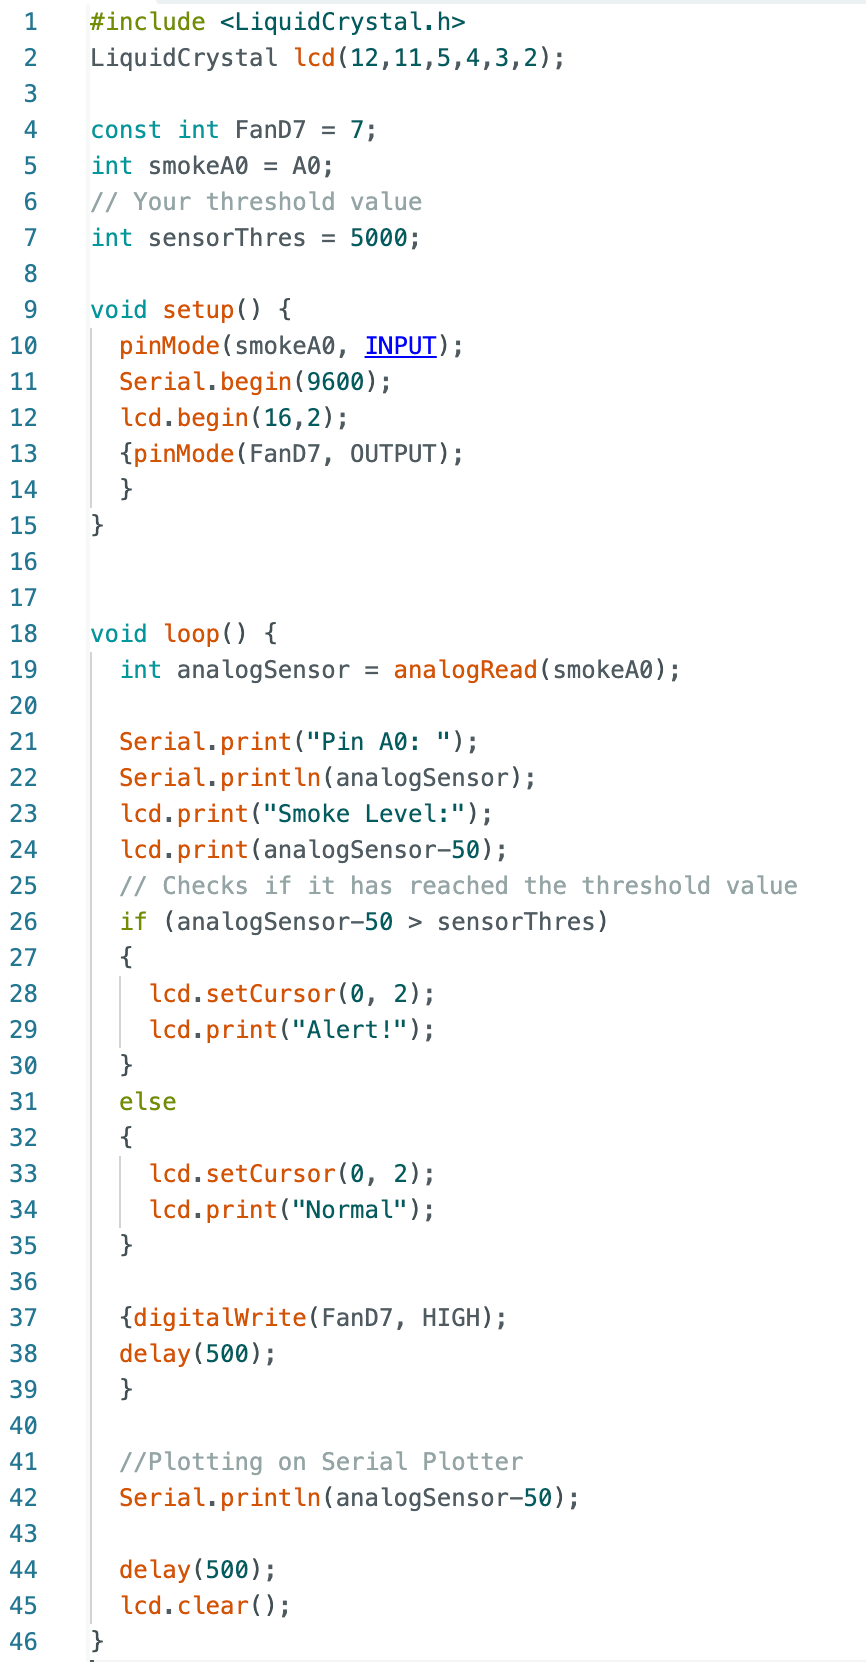
The picture above shows the code that was implemented in the sensor. A loop was created return a smoke sensor quality index (AQI) to a liquid crystal display (LCD). The whose measurement would be assisted by the blowing of particulate air molecules by the fan. An air quality measurement was returned every 500 milliseconds.
Observations
In prior runs, the quality seemed to be affected by other aspects of the urban environment. The AQI would significantly increase near cars that were on, and seemed to drop when nearby plants such as trees or flowers.
Similarly, urban design seemed to have an affect. Areas concentrated with more parked cars would generally give higher ratings relative to spaces that were more open. In open spaces, the AQI measurement would generally drop. This became especially true at intersections because of what we were measuring.
The areas seemed to have a high concentration of smokers due to the amount of cigarette butts on the ground. Interestingly enough, during our preliminary walkthroughs we saw more smokers on Broadway than Amsterdam.
Results
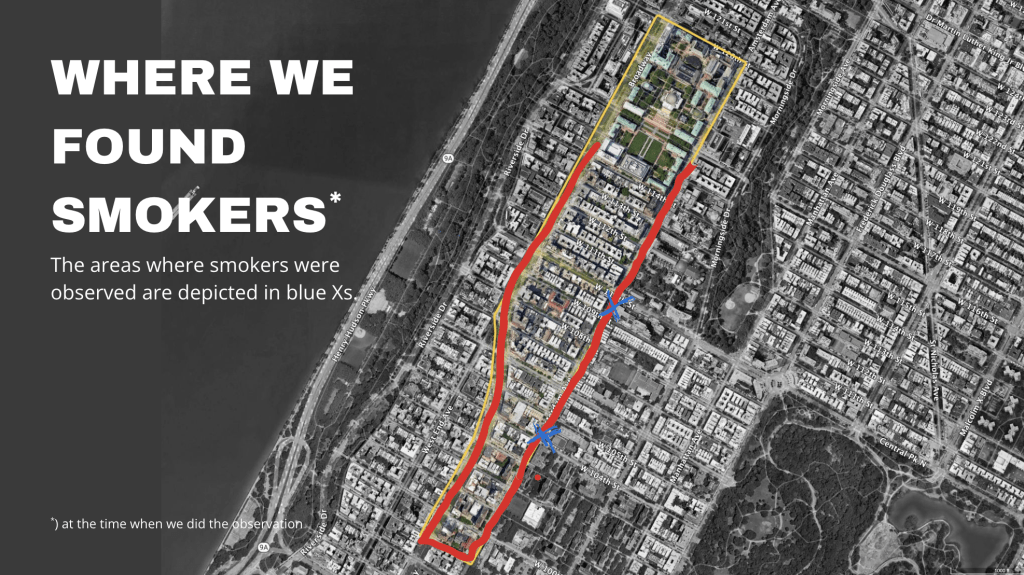
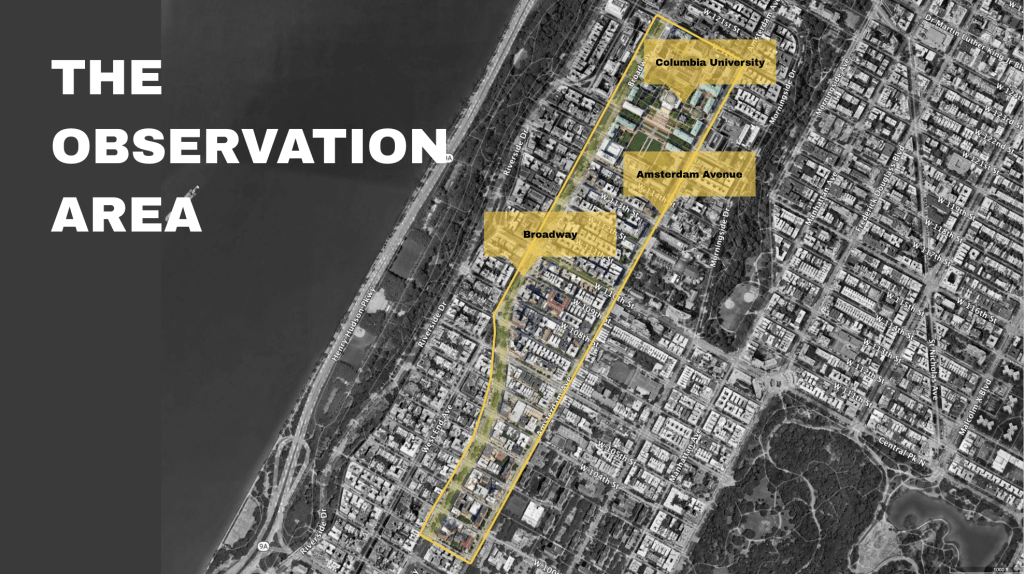
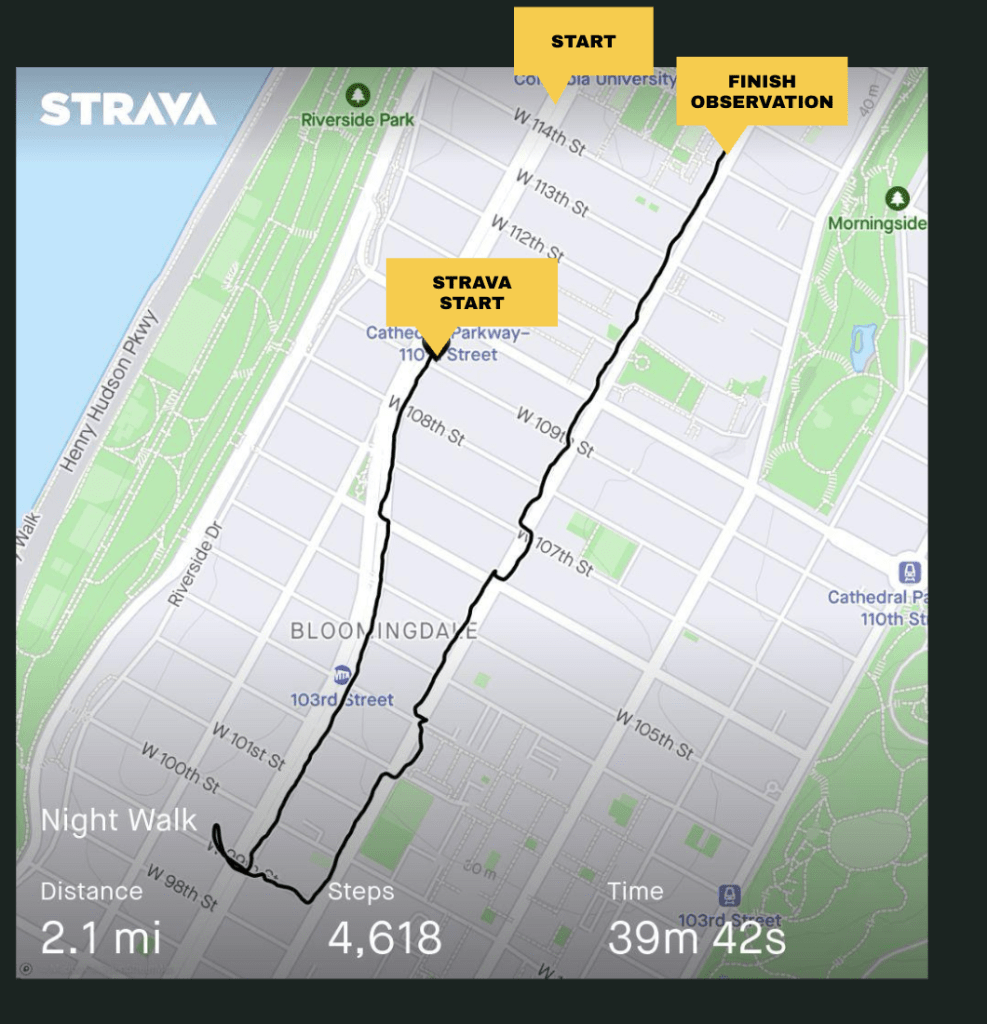
The projected walking path is depicted in the picture above in yellow. The actual path that we walked is depicted in red. The areas smokers where the smokers were found were depicted that blue Xs. More smokers were found on Amsterdam Avenue, as compared to previous trial runs which showed more smokers on Broadway Avenue.
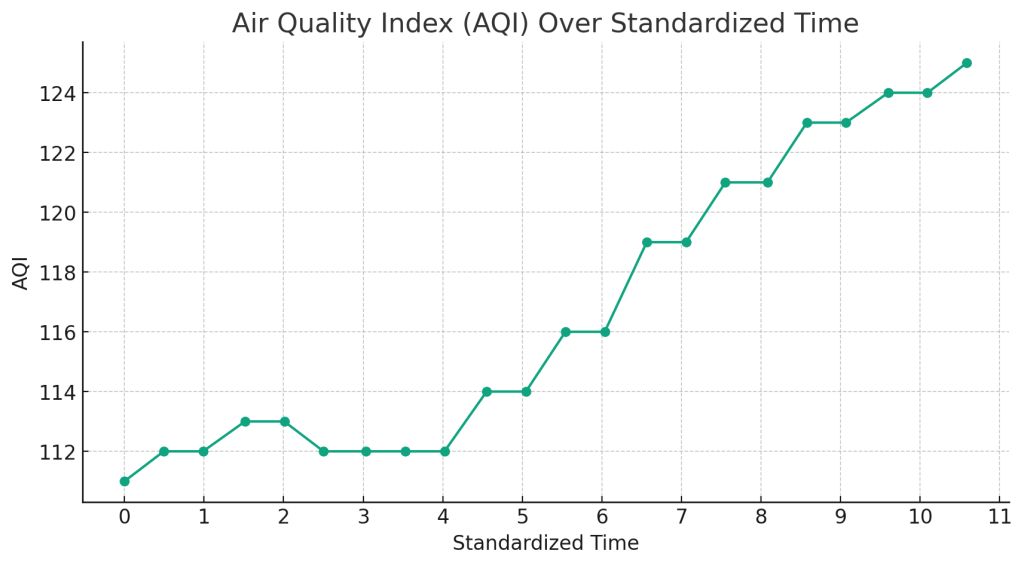
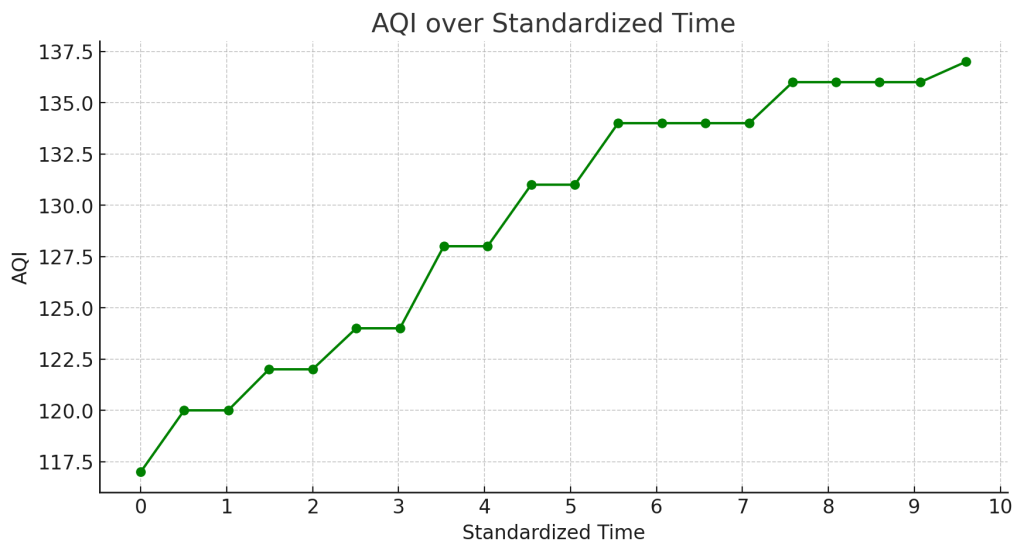
The AQI after passing a smoker generally increased, staying within a range of 7 to 20 AQI points.
Limitations
Several limitations were found during the study:
In primary runs, the air quality seemed too volatile at first. The sensor generally needed some time to calibrate before trial runs because of its sensitivity.
There were some delays on the data taking because of the 1-second intervals observation, therefore the data shown in the lcd is not really showing real-time.
Data collection typically consisted of large files granted that each walking route was observed in 1-second intervals to ensure that the intricacies of the personal experience were captured. It took significant time to comb through the data to find the smoking scenarios even with manual timestamps.
The research team was unable to perform measurements during several different times of day. Limitations in our commitments created limited time frames for data collection, not allowing for data collection at several different time periods.
Conclusions
People are affected by secondhand smoke. This might not be by a significant amount, but it does have an affect on the personal experiences of individuals.
While this study looked primarily at us as individuals, understanding several individual experiences can help to create a collective narrative about public health in transportation at the urban and regional scale.
Air quality alone does not tell a whole story, but could contribute to a more holistic story when paired along other data, such as some from olfaction sensors.
An average of 2-5 smokers per walking session makes it difficult to measure pedestrian secondhand smoking. In order to measure the effects of secondhand smokers, higher frequencies of smokers need to be measured.
Next Steps
More repetitions should be done to ensure that the results are accurate. At least 30 repetitions should be done. This semester the research team had a large learning curve to understand urban sensing technology.
In future iterations, several different kinds of sensors could be utilized for data triangulation. More advanced particulate matter sensors, nicotine sensors, and polymer film sensors could all be additional options for urban sensing and data production surrounding pedestrian secondhand smoke.
Measuring the effects of secondhand smoke is complex. This project did not take into account factors such smoking stylesmoking etiquette, and if people are blowing smoke directly at you, which would affect how much secondhand smoke one would be exposed to. Further studies should account for these factors.